
03
May
OBIEE and tiles without Narrative
May 3, 2017
How was it done?
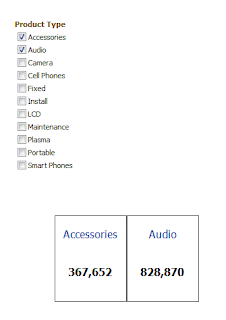
I created a basic report:
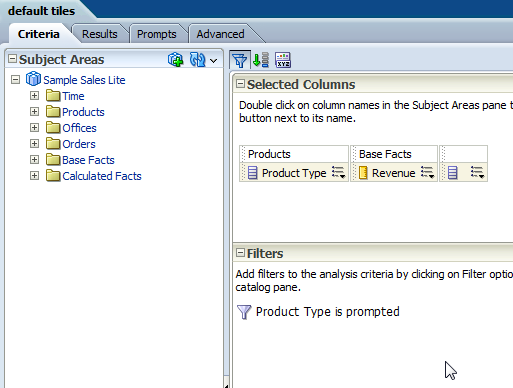
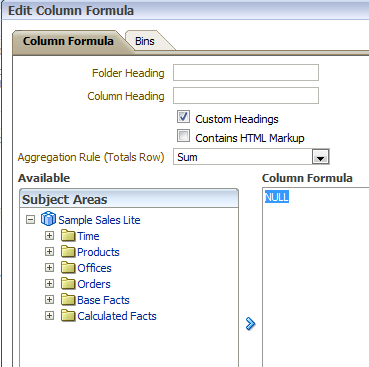
The last column has no meaning, we just need something to be in the measures part. In my case I decided to have a column of NULLs with space as a label.
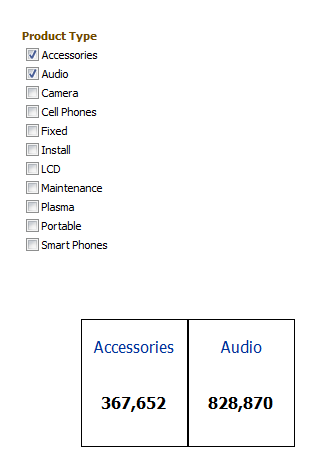
So I create a Pivot:

And rearrange it:
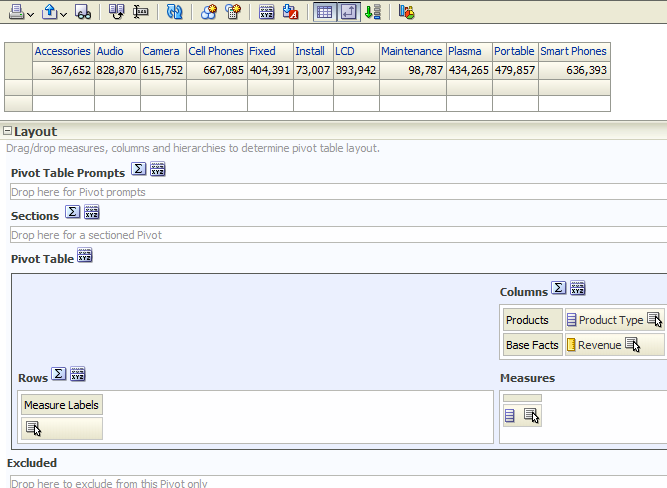
Now we need to arrange the Product Type and Revenue so each pair will look like a single tile and hide the measures. The last part is the most interesting: how to hide the leftmost part.
So on the rows properties, remove the Display Heading mark, to loose and extra line:

Then select format values for each column.
First the top – product type:
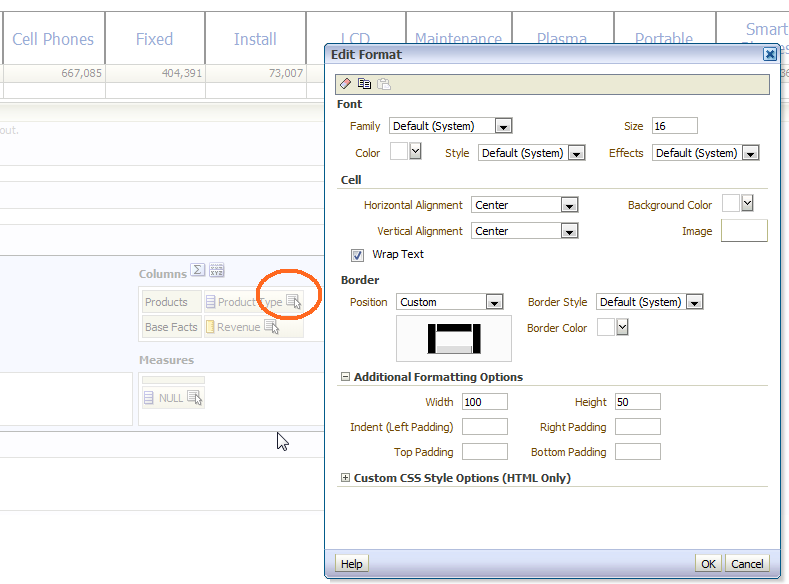
The important parts are: Border, font size and Background Color (I changed to white).
Something similar can be done with the second column (Revenue):
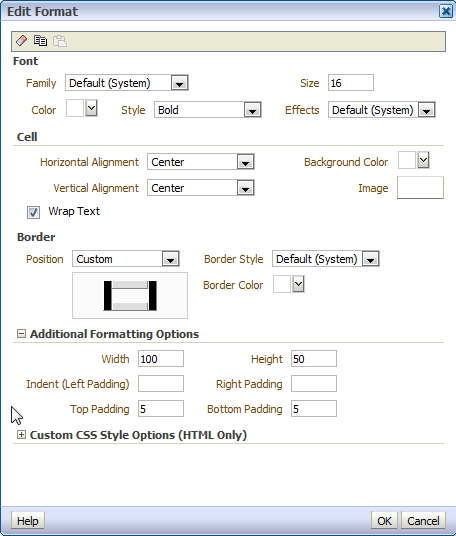
Pay attention to the border, no bottom.
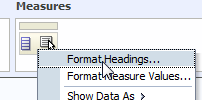
And now lets deal with the NULL column at the measure. First Format Headings:
White background color and no Border.

Now the Format Measure Values:
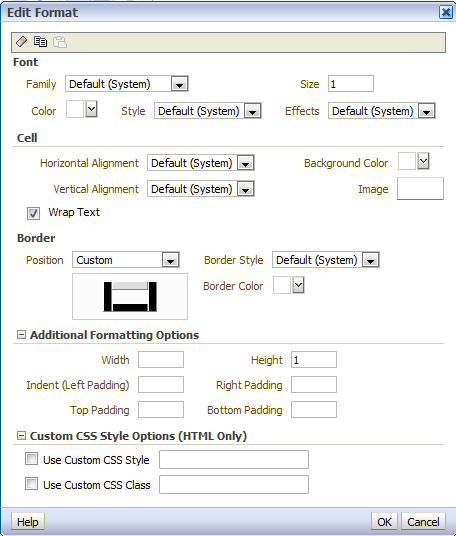
Lets minimize it to size of 1 and close the border at the bottom.
So what is left? We have this ugly area at the left. The bottom part of it was solved when we fixed the measure values heading. Now we need to deal with the rest.
How do we hide it?
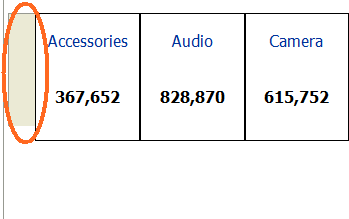
This is a style trick.
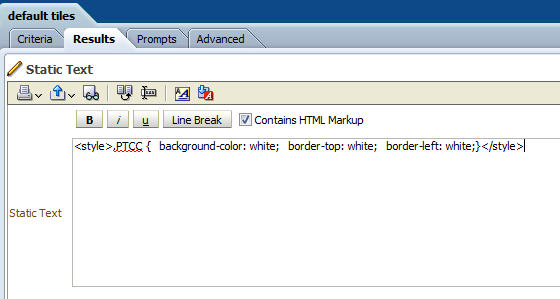
Add a Static Text to the Analysis. Mark as Contains HTML and paste the following:
<style>.PTCC { background-color: white; border-top: white; border-left: white;}</style>
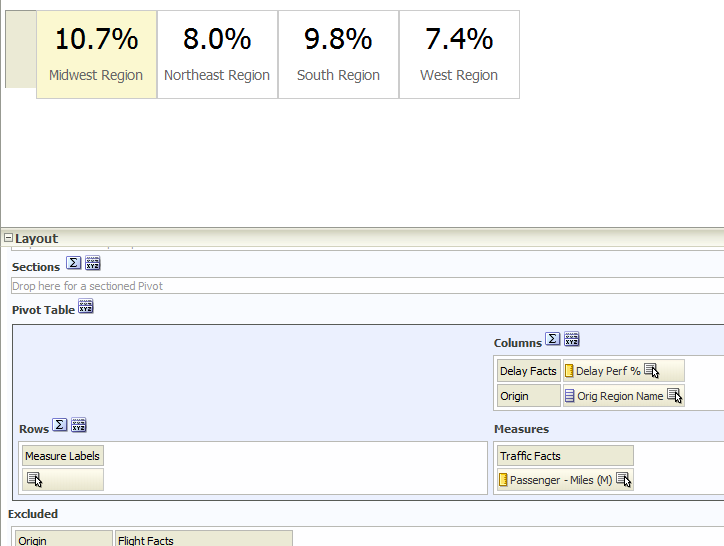
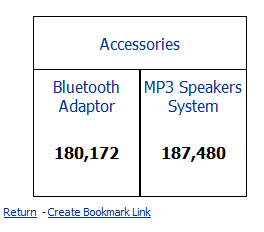
Now it’s perfect:

Naturally Drills and Navigate options work:
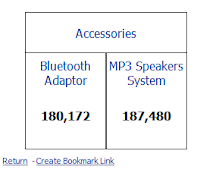
When I drill on the Accessories:
No Comments